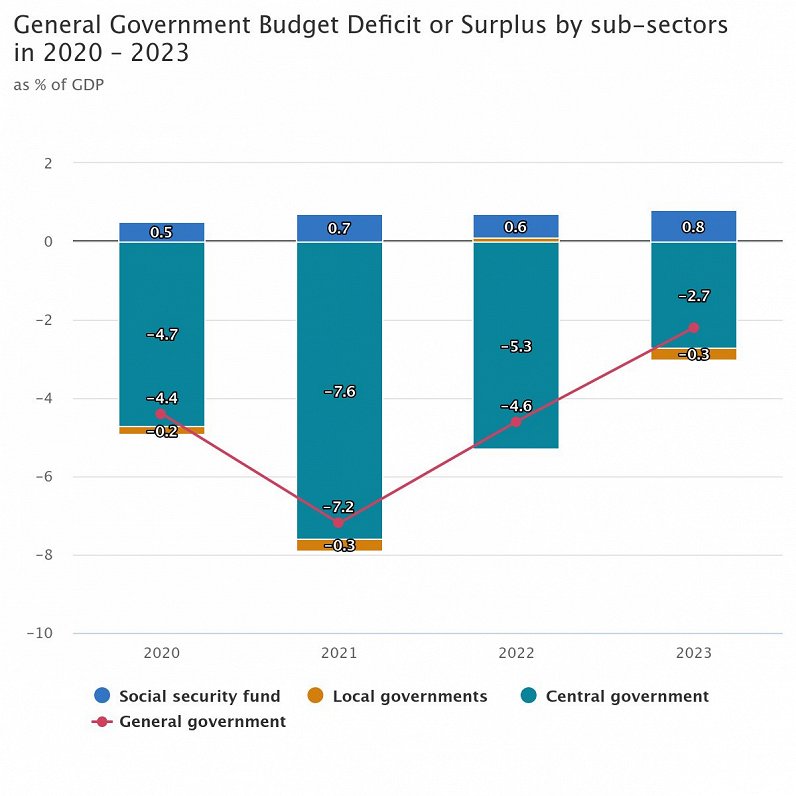
The full figures are laid out in the table below and show the deficit level fairly stable in recent years – with the exception of 2021 when the effects of the Covid-19 crisis required significant amounts of emergency spending.
|
|
2020 |
2021 |
2022 |
2023 |
Budget deficit (-) / Surplus (+), million EUR |
||||
General government |
-1 318.5 |
-2 396.1 |
-1 778.8 |
-893.1 |
Central government |
-1 423.7 |
-2 547.9 |
-2 024.6 |
-1 070.8 |
Local governments |
-45.8 |
-89.5 |
+20.5 |
-136.8 |
Social security fund |
+151.0 |
+241.3 |
+225.3 |
+314.5 |
General government budget deficit as % of GDP |
4.4 |
7.2 |
4.6 |
2.2 |
Consolidated gross debt at nominal value at the end of the year, million EUR |
|
|
|
|
General government |
12 869.4 |
14 809.0 |
16 038.7 |
17 581.4 |
Central government |
13 680.3 |
16 016.9 |
17 653.6 |
19 401.8 |
Local governments |
2 133.3 |
2 253.0 |
2 323.8 |
2 338.6 |
General government consolidated gross debtat nominal value at the end of the year as % of GDP |
42.7 |
44.4 |
41.8 |
43.6 |
General government expenditure in 2023, compared to 2022, rose by 5.2 % and reached EUR 16.5 billion, of which EUR 0.4 billion were expenditure on support measures to compensate the increase in energy resource prices, but income increased by 12.3 % and reached EUR 15.6 billion.
General government consolidated gross debt accounted for EUR 17.6 billion or 43.6 % of the GDP and during a year it has increased by EUR 1.5 billion. In 2023 rise in general government debt was affected by the issuance of three new Eurobonds.


