Retail trade in food products decreased by 0.6 %, retail trade in non-food products (except for retail sale of automotive fuel) – by 23.4 %, but turnover of retail sale of automotive fuel – increased by 14.8 %.
As compared to January 2020, the most notable turnover growth was registered in retail sale of electrical household appliances in specialized stores (of 21.2 %) and retail sale via mail order houses or via Internet (11.9 %). Turnover drop was registered in other retail trade sectors, largest of them – in retail sale of clothing, footwear and leather goods (of 64.0 %), retail sale in non-specialized stores selling mainly non-food products (41.8 %) and retail sale of cultural and recreation goods (29.2 %).
Total retail trade turnover at current prices fell by 11.4 % (not taking into account the calendar influence).
Compared to December, the total turnover of retail trade enterprises in January 2021 fell by 4.9 %, according to seasonally adjusted data at constant prices. Retail trade in food products decreased by 1.4 %, retail trade in non-food products (except for retail sale of automotive fuel) – by 11.8 %. Retail sale of automotive fuel rose by 3.2 %.
Compared to the previous month, the most notable turnover rise was recorded in retail sale via mail order houses or via Internet (of 18.7 %), retail sale of electrical household appliances in specialized stores (16.4 %) and retail sale of information and communication equipment in specialized stores (9.3 %). The largest turnover drop was registered in retail sale of clothing, footwear and leather goods (of 43.5 %), retail sale in non-specialized stores selling mainly non-food products (30.9 %) and retail sale of hardware, instruments, construction materials and sanitary equipment (20.6 %).
Compared to December, in January 2021 the total retail trade turnover at current prices (not taking into account seasonality) decreased by 23.2 %.
Turnover indices of retail trade enterprises by main kind of economic activity
(at constant prices)
|
|
January 2021 as %, compared to: |
|
|
December 2020 (seasonally adjusted) |
January 2020 (calendar adjusted) |
|
|
Retail trade – total |
95.1 |
91.1 |
|
retail sale of food products, total |
98.6 |
99.4 |
|
retail sale of non-food products, except for retail sale of automotive fuel, total |
88.2 |
76.6 |
|
retail sale in non-specialised stores selling mainly non-food products |
69.1 |
58.2 |
|
retail sale of information and communication equipment in specialised stores |
109.3 |
90.8 |
|
retail sale of electrical household appliances in specialised stores |
116.4 |
121.2 |
|
retail sale of hardware, instruments, construction materials and sanitary equipment |
79.4 |
71.1 |
|
retail sale of cultural and recreation goods |
97.0 |
70.8 |
|
retail trade in pharmaceutical and medical goods |
93.9 |
99.8 |
|
retail sale of cosmetics and toiletries |
89.4 |
72.1 |
|
retail sale of clothing, footwear and leather goods |
56.5 |
36.0 |
|
retail sale in stalls or markets |
107.5 |
76.8 |
|
retail sale via mail order houses or via Internet |
118.7 |
111.9 |
|
retail sale of automotive fuel |
103.2 |
114.8 |
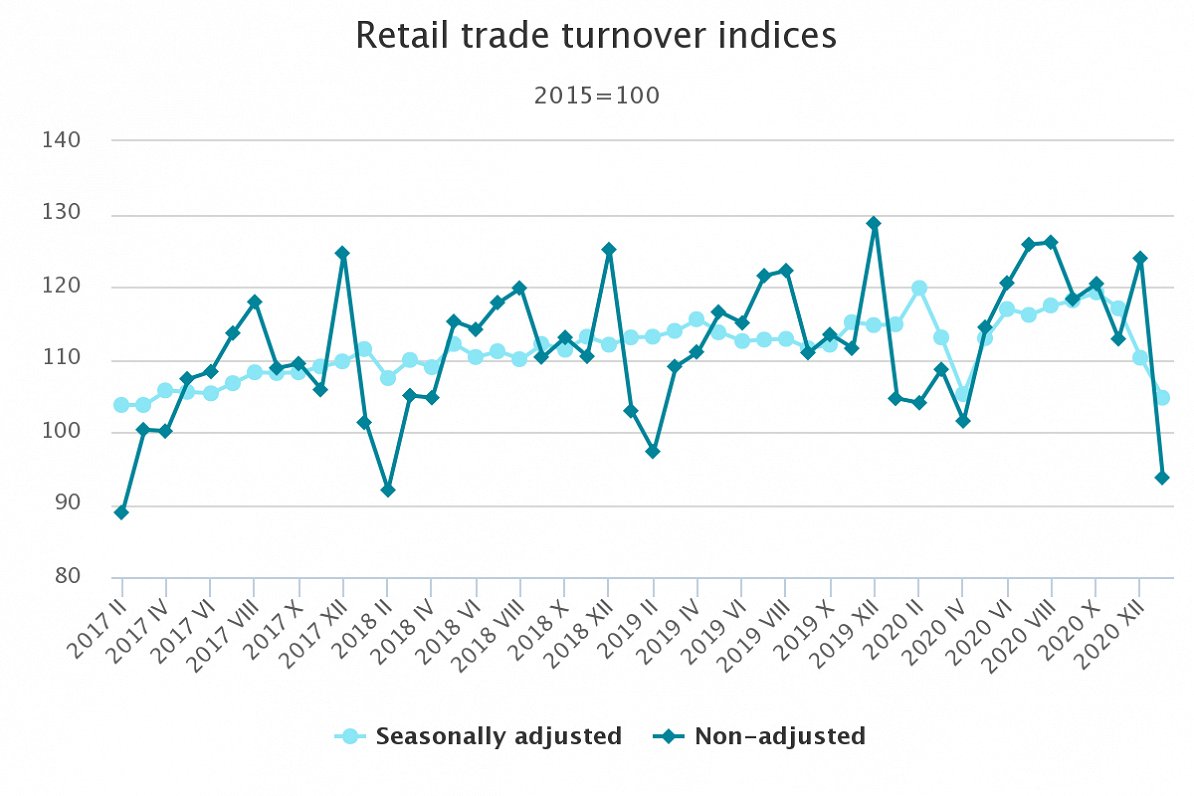
More information on seasonally adjusted, calendar adjusted and non-adjusted retail trade turnover indices is available in the Official statistics portal “Trade and services”.