Productivity declined substantially in 2020 when compared to the trend over the preceding decade, but before that, Latvia demonstrated one of Europe's more productive workforces.
The data are complex and make it tricky to draw simple conclusions but nevertheless are worth noting, with economists frequently citing the need for increased productivity as a key factor for the future economic well-being of the country.
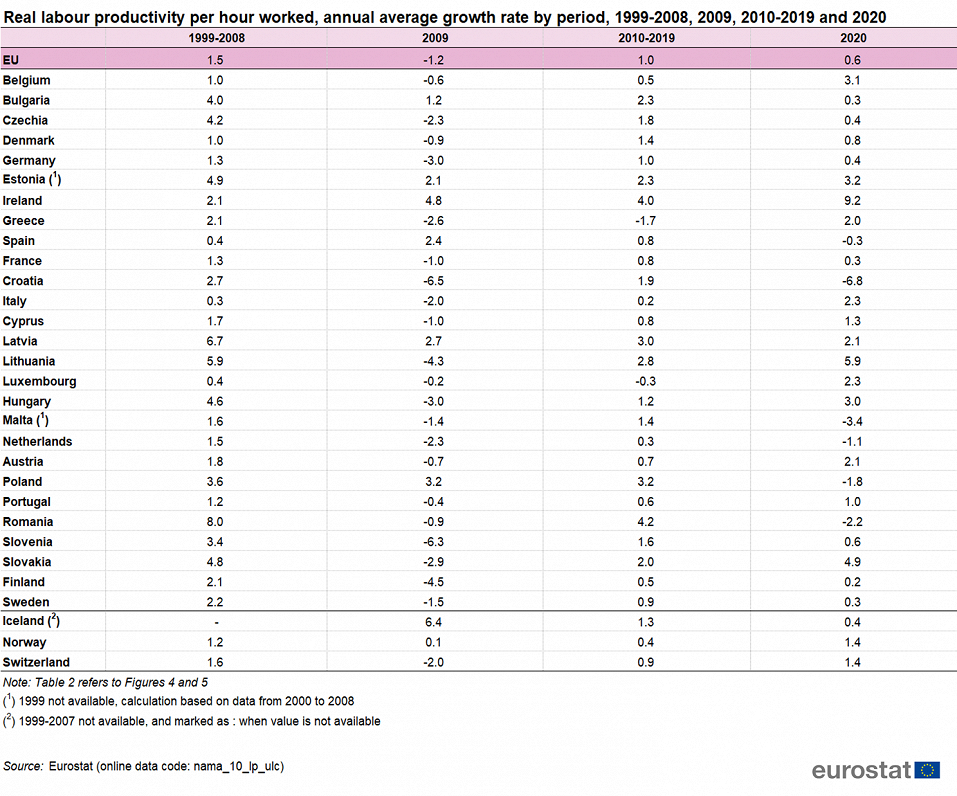
The figures try to compare the impact of the 2009 economic crisis and the 2020 COVID-19-related crisis on the EU economy.
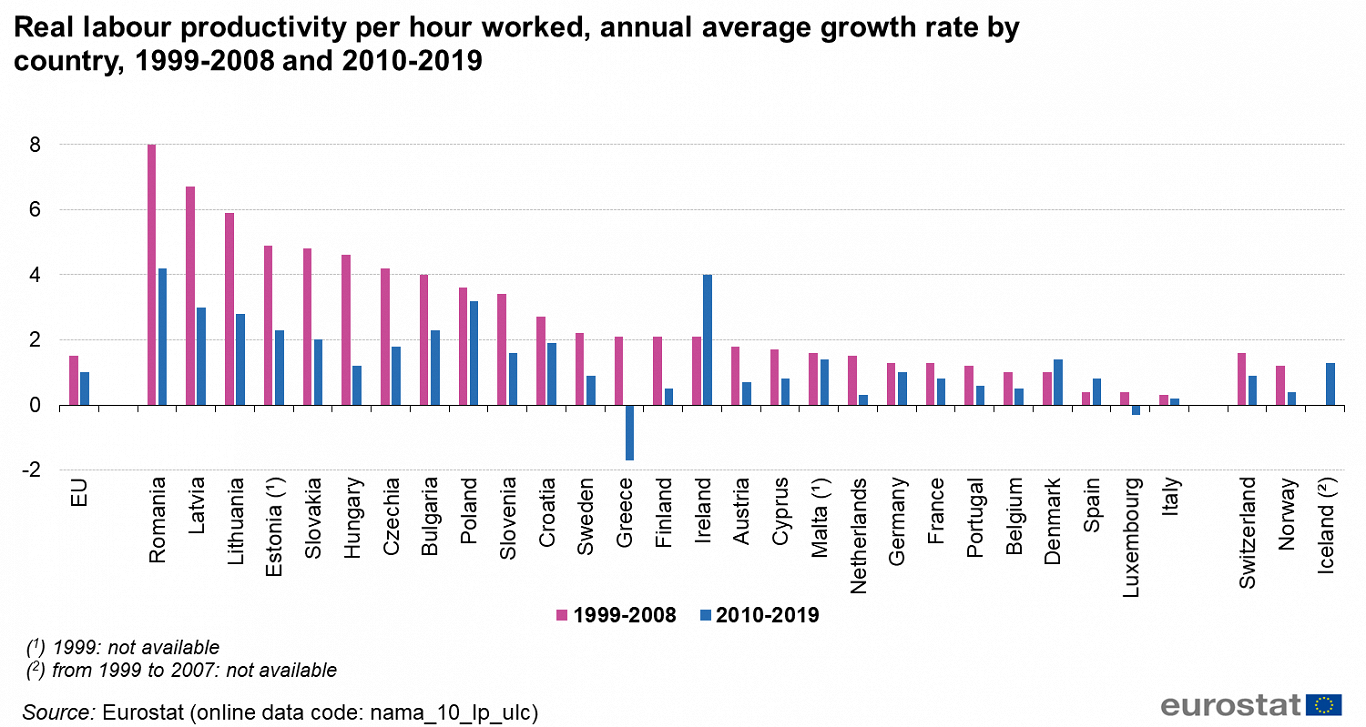
"Over the period from 1999 to 2008, it can be noted that productivity growth was much higher for central and eastern European countries, which profited from a catching-up and convergence process sparked by the transition to a market economy and by joining the EU between 2004 and 2007. While productivity growth broadly halved in many of these countries after the financial crisis (except for Poland, Bulgaria, Malta and Croatia), it was usually still significantly higher in the post-financial-crisis period than for other EU countries," Eurostat noted.
"Comparing the effects of the 2009 financial crisis and the 2020 COVID-19 crisis on EU countries’ labour productivity per hour worked shows a wide variance across countries. In 2009, labour productivity per hour worked declined in most of the countries, with considerable decreases for Croatia (-6.5 %) and Slovenia (-6.3 %). Only a few countries saw a positive change in labour productivity per hour worked in 2009, including Ireland (+4.8 %), Poland (+3.2 %), Latvia (+2.7 %), Spain (+2.4 %), Estonia (+2.1 %) and Bulgaria (+1.2 %). In 2020, most of the countries recorded an increase in labour productivity, due to relatively larger declines in hours worked than in GDP caused by COVID-19 lockdowns."
Another metric used presents Latvia as one of the most productive countries in the bloc.
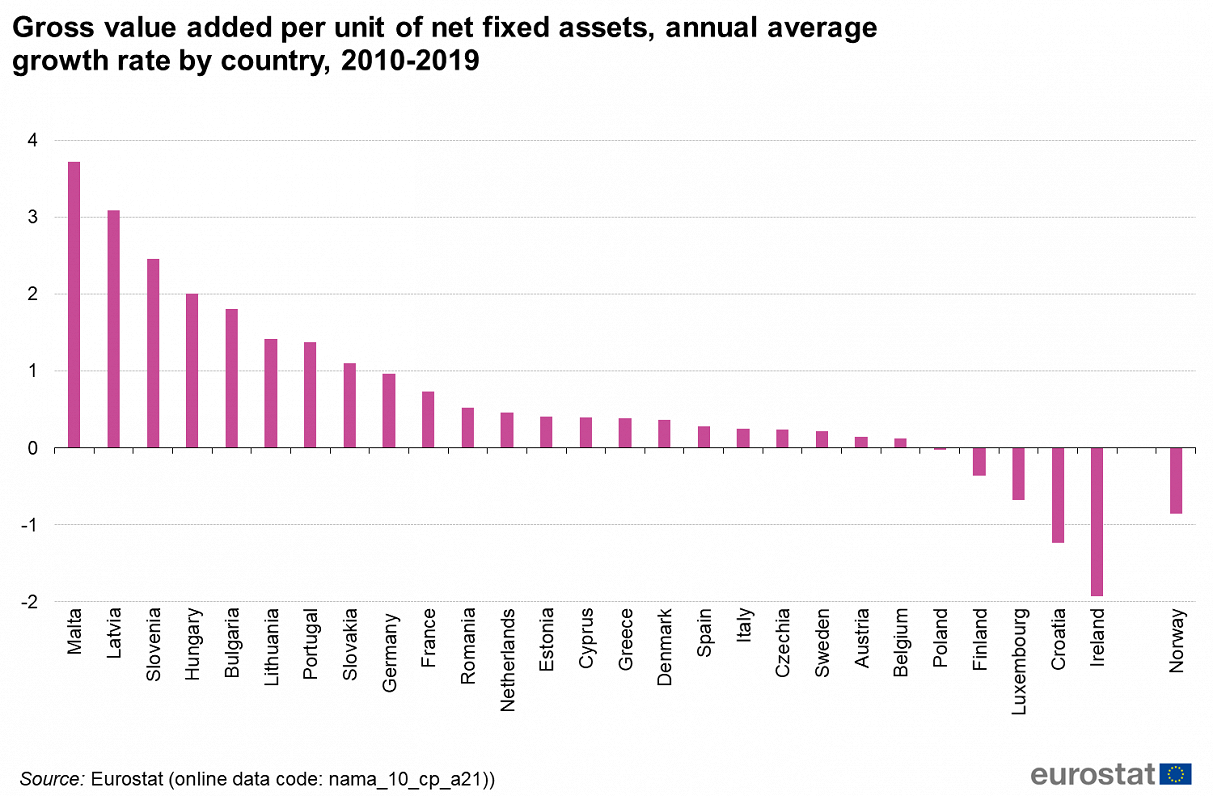
The following graph presents a cross-country comparison of a proxy for capital productivity, measured as real gross value added per unit of net fixed assets. This indicator shows the relation between the units of output (real gross value added) produced and one unit of capital stock (input). Over the period 2010-2019, the annual average growth rate of gross value added per unit of net fixed assets varied considerably across countries. A large majority of Member States recorded positive growth, in other words, on average, output grew faster than capital input. The highest growth was registered by Malta (+3.7 %), followed by Latvia (+3.1 %) and Slovenia (+2.5 %). On the other hand, gross value added per unit of net fixed assets declined for a few countries, notably Ireland (-1.9 %) and Croatia (-1.2 %).
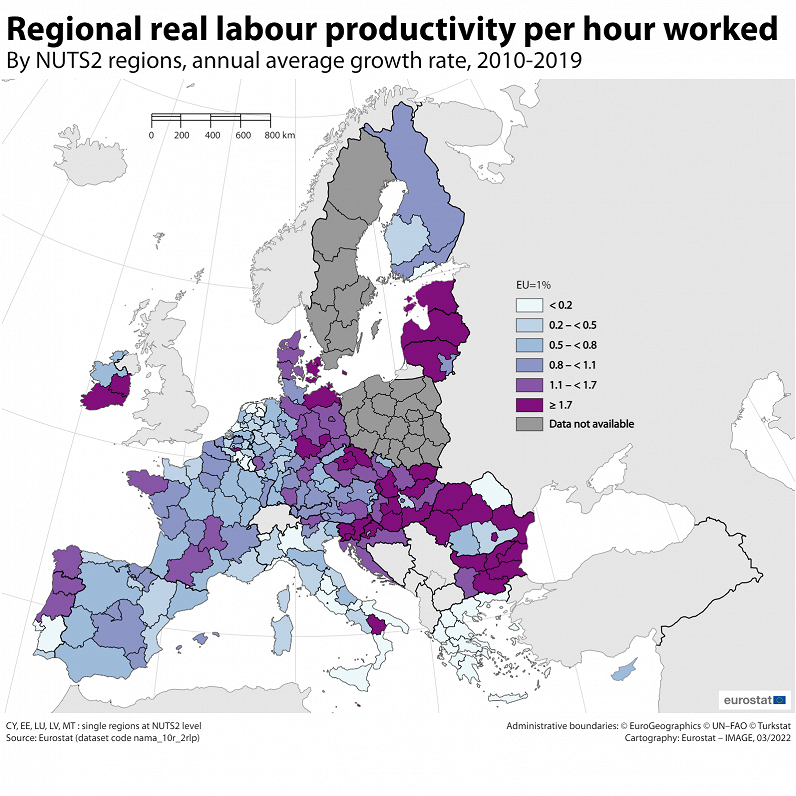
Labor productivity can be analysed for regional accounts data available for the European Union’s (EU) NUTS level 2 regions. Several Member States (Cyprus, Estonia, Luxembourg, Latvia and Malta) only have a single level 2 region, in these cases the regional labour productivity indicator corresponds to the one at national level.
Regional labour productivity per hour worked is computed as an index (2015=100) based on gross value added in chain linked volumes. In order to smooth out the volatility typically observed in regional growth year on year, the annual average growth rate was calculated over the period 2010-2019. It was not possible to compute the regional labour productivity per hour worked for Poland and Sweden because the historical data series were not available. The following map illustrates regional growth in labour productivity for the EU regions.