In 2021, 38.2 % of the disposable income in the EU Member States was attributed to the 20 % of the population with the highest income, while the 20 % with the lowest income received a 7.9 % share.
In 2021, the 20 % of the population with the highest income in Bulgaria, Lithuania, Latvia and Portugal received more than 40.0 % of the disposable income within their respective countries. In most of the EU Member States, the share of the highest 20 % was in 2021 at least 35.0 % of total disposable income. Values below 35.0 % were recorded in Belgium (33.8 %), Slovenia (33.2 %) and Slovakia (31.2 %, 2020 data).
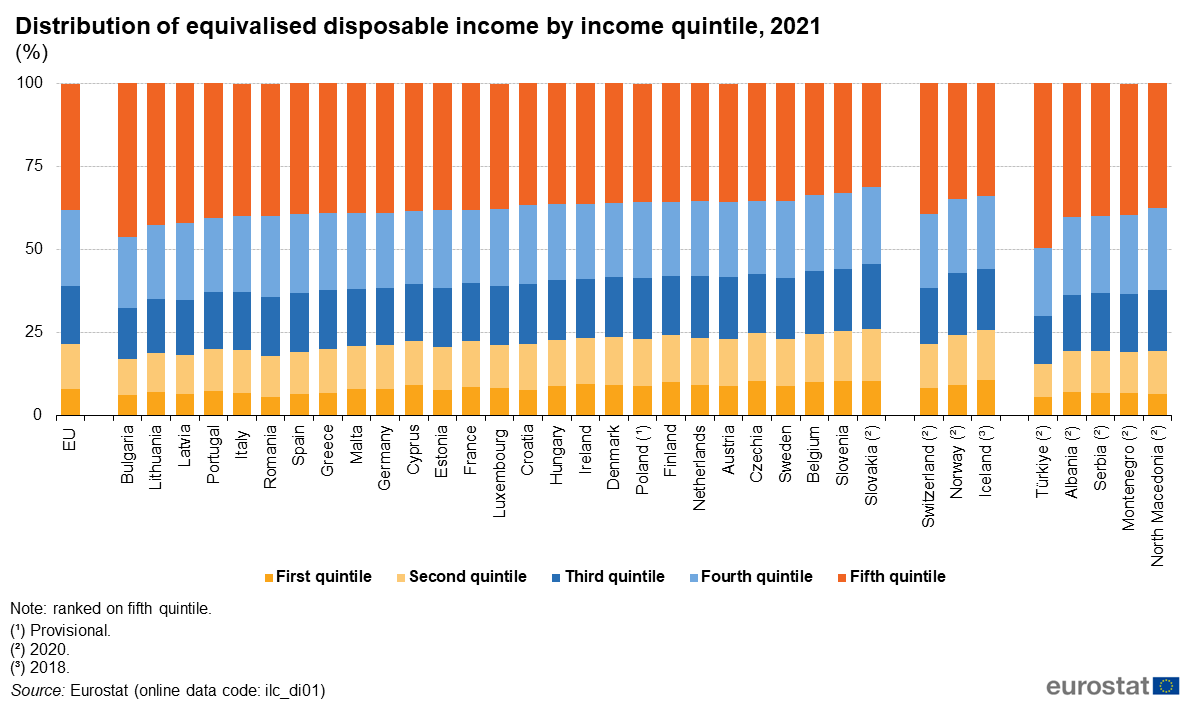
At the other end of the income scale, the 20% of the population with the lowest income (people in the bottom quintile) received less than 7.9 % (which was the average in the EU Member States) of the disposable income in 11 Member States. Among those Member States, shares below 7.0 % were recorded in Greece, Italy, Latvia, Spain, Bulgaria and Romania (where the lowest share of 5.6 % was recorded). Only in Czechia, Slovenia, Slovakia (2020 data) and Finland was the share of disposable income received by people in the bottom quintile greater than or equal to 10.0 %, while it was close to this level in Belgium (9.9 %) and Ireland (9.5 %).
Income inequality
"While median disposable income provides a measure of average living standards, excluding the potential distortion of aggregate measures such as GDP per capita, it still fails to offer a complete picture as it does not capture the distribution of income within the population and thereby does little to reflect economic inequalities. Gini coefficient and the income quantile share ratio (S80/S20), described below, are used to provide insight into income inequalities," explained Eurostat.
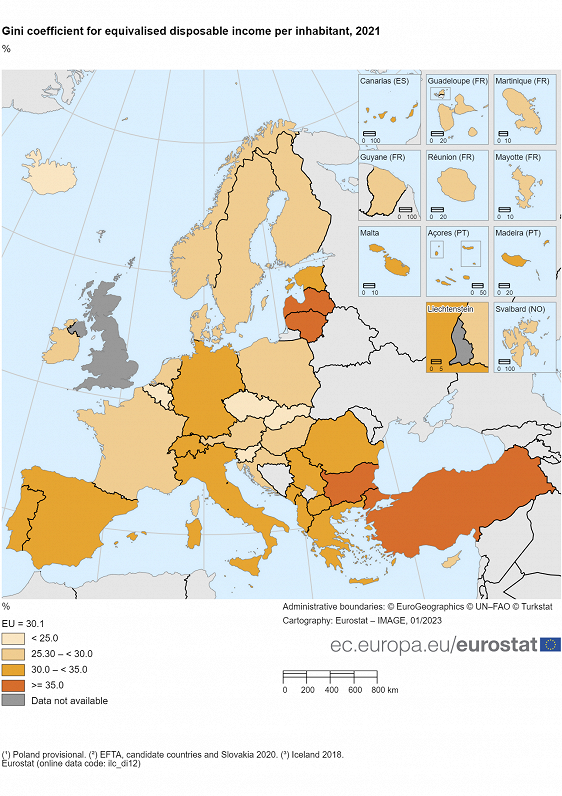
In 2021, the Gini coefficient for the EU was 30.1 %. The highest income disparities among the EU Member States were recorded in Bulgaria (39.7 %), Latvia (35.7 %) and Lithuania (35.4 %).
A second group of Member States, with a Gini coefficient above the EU average of 30.1 % (in the range of 30.6 % to 34.3%), comprised Estonia, Germany, Malta, Greece, Italy, Spain, Portugal and Romania. At the other end of the scale, income was more evenly distributed in Slovakia (2020 data), Slovenia, Belgium and Czechia, where the Gini coefficient was less than 25.0 %.