Exports value of goods dropped by 3.7%, but imports value of goods – by 4.8%.
In August Latvia exported goods in the amount of EUR 1.07 billion, but imported – in the amount of EUR 1.23 billion. Compared to August 2019, foreign trade balance has improved slightly as exports in total foreign trade amount increased from 46.3 % to 46.6 %.
During the eight months of this year foreign trade turnover of Latvia at current prices reached EUR 17.64 billion – EUR 1.3 billion or 6.8 % less than in the corresponding period of the previous year. The exports value constituted EUR 8.18 billion (a drop of EUR 271.8 million or 3.2 %), whereas the imports value comprised EUR 9.46 billion (a fall of EUR 1.02 billion or 9.8 %).
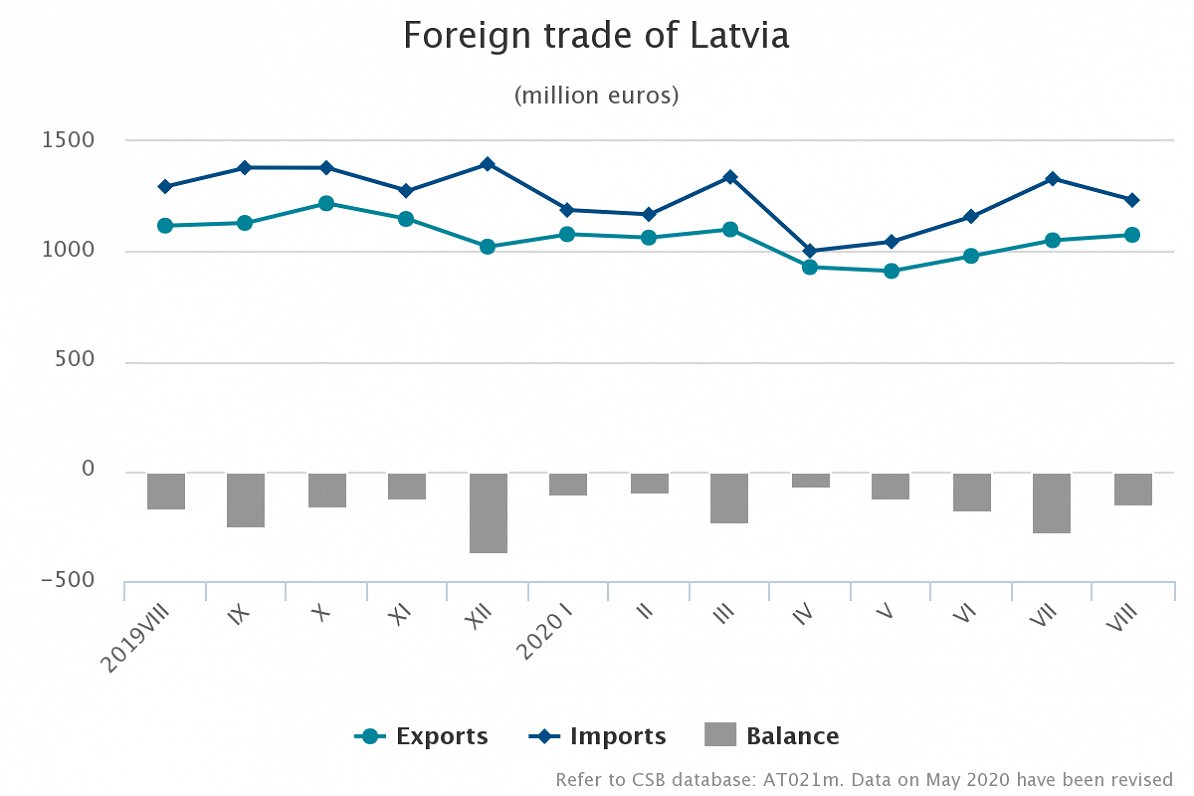
Calendar and seasonally adjusted data show that, compared to August 2019, in August 2020 the exports value at current prices went up by 0.5 %, but the imports value – down by 3 %, whereas, compared to the previous month, the exports value went up by 3.7 % ,but the imports value – down by 1.5 %.
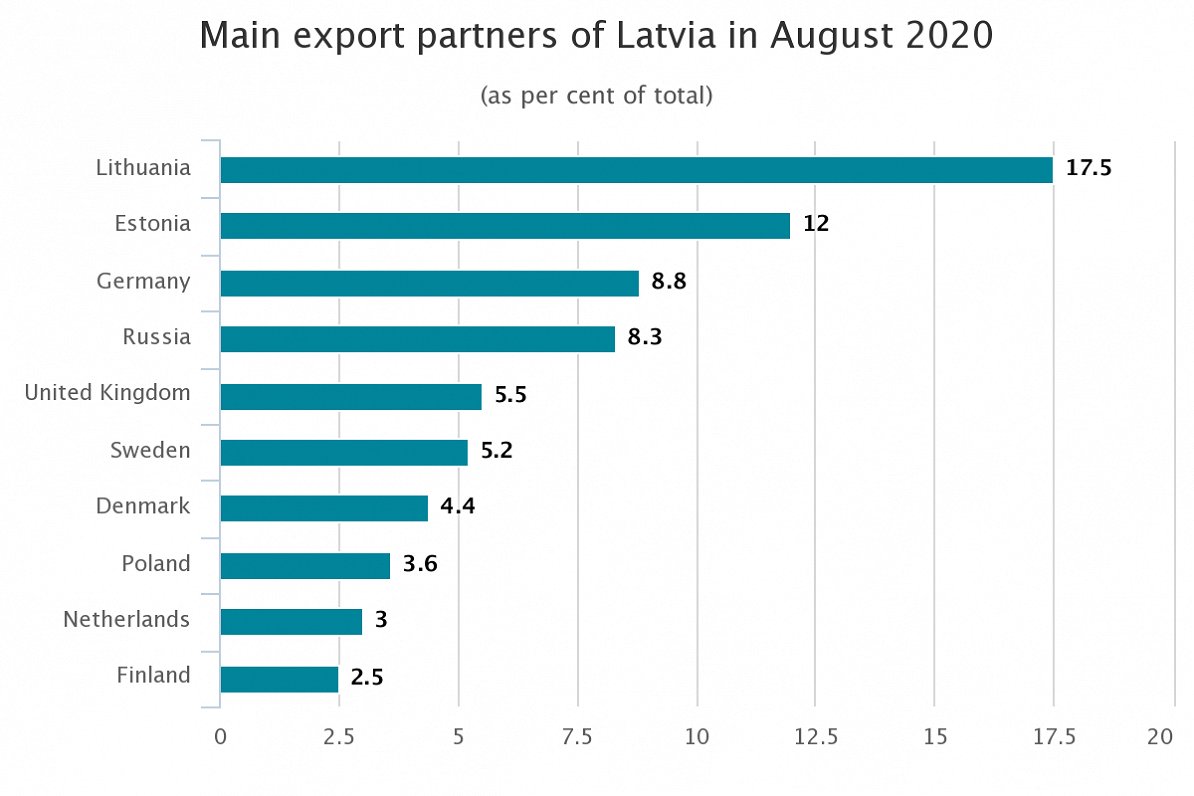
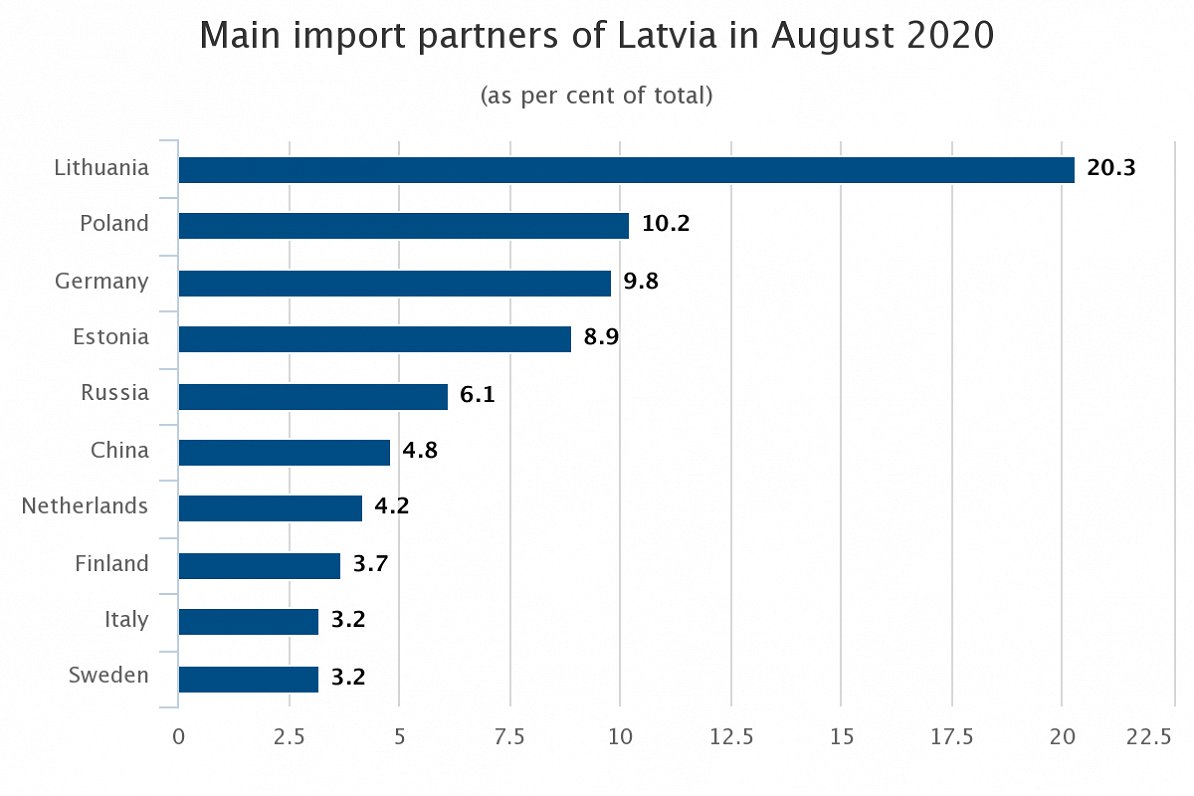
In August, the main export partners of Latvia in trade with EU countries were Lithuania (17.5 % of total exports), Estonia (12 %), Germany (8.8 %) and Sweden (5.2 %), whereas the main import partners were Lithuania (20.3 % of total imports), Poland (10.2 %), Germany (9.8 %) and Estonia (8.9 %). Russia was the main partner in trade with third countries; its share in total Latvian exports in August accounted for 8.3 %, whereas in imports – for 6.1 %.
In August 2020, compared to August 2019, share of the European Union countries in total exports value increased by 1.2 percentage points, but in imports value – fell by 0.2 percentage points. Share of CIS countries in exports fell by 1.2 percentage points, but in imports – by 1.6 percentage points.
Foreign trade of Latvia in August 2020 by country group
(at current prices)
|
|
Exports |
Imports |
||||
|
|
million EUR |
% of total |
changes as %, compared to August 2019 |
million EUR |
% of total |
changes as %, compared to August 2019 |
|
Total |
1 074.6 |
100 |
-3.7 |
1 232.4 |
100 |
-4.8 |
|
European Union countries* |
717.1 |
66.7 |
-1.9 |
941.5 |
76.4 |
-5.0 |
|
euro area countries |
551.2 |
51.3 |
-0.6 |
709.2 |
57.6 |
-6.6 |
|
CIS countries |
135.0 |
12.6 |
-12.4 |
121.1 |
9.8 |
-17.9 |
|
other countries |
222.5 |
20.7 |
-3.8 |
169.8 |
13.8 |
8.9 |
Full report can be read at CSB website.