Exports value of goods was 13 % higher, but imports value of goods – 3.5% higher.
In September Latvia exported goods in the amount of EUR 1.28 billion, but imported – in the amount of EUR 1.43 billion. Compared to September 2019, foreign trade balance has improved slightly as exports in total foreign trade amount increased from 45 % to 47.2 %.
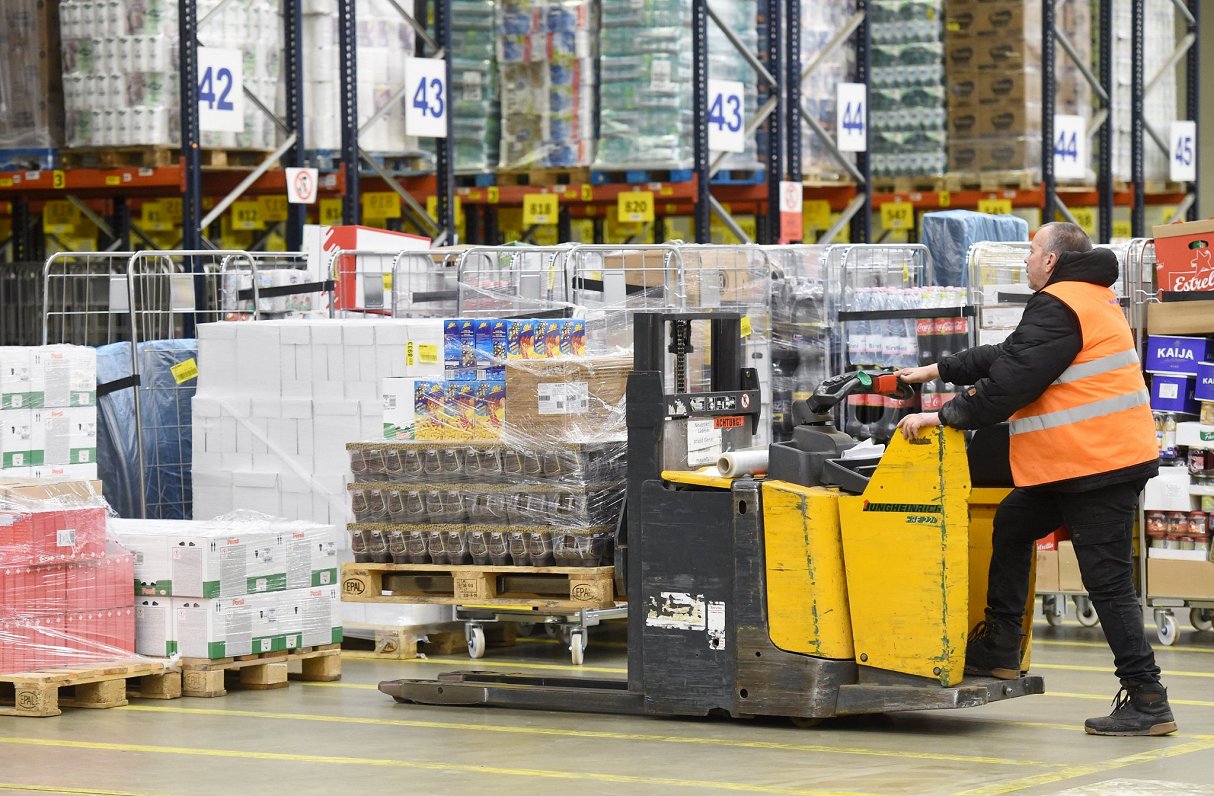
During the nine months of this year foreign trade turnover of Latvia at current prices reached EUR 20.36 billion – EUR 1.09 billion or 5.1 % less than in the corresponding period of the previous year. The exports value constituted EUR 9.46 billion (a drop of EUR 123.8 million or 1.3 %), whereas the imports value comprised EUR 10.9 billion (a fall of EUR 962.5 million or 8.1 %).
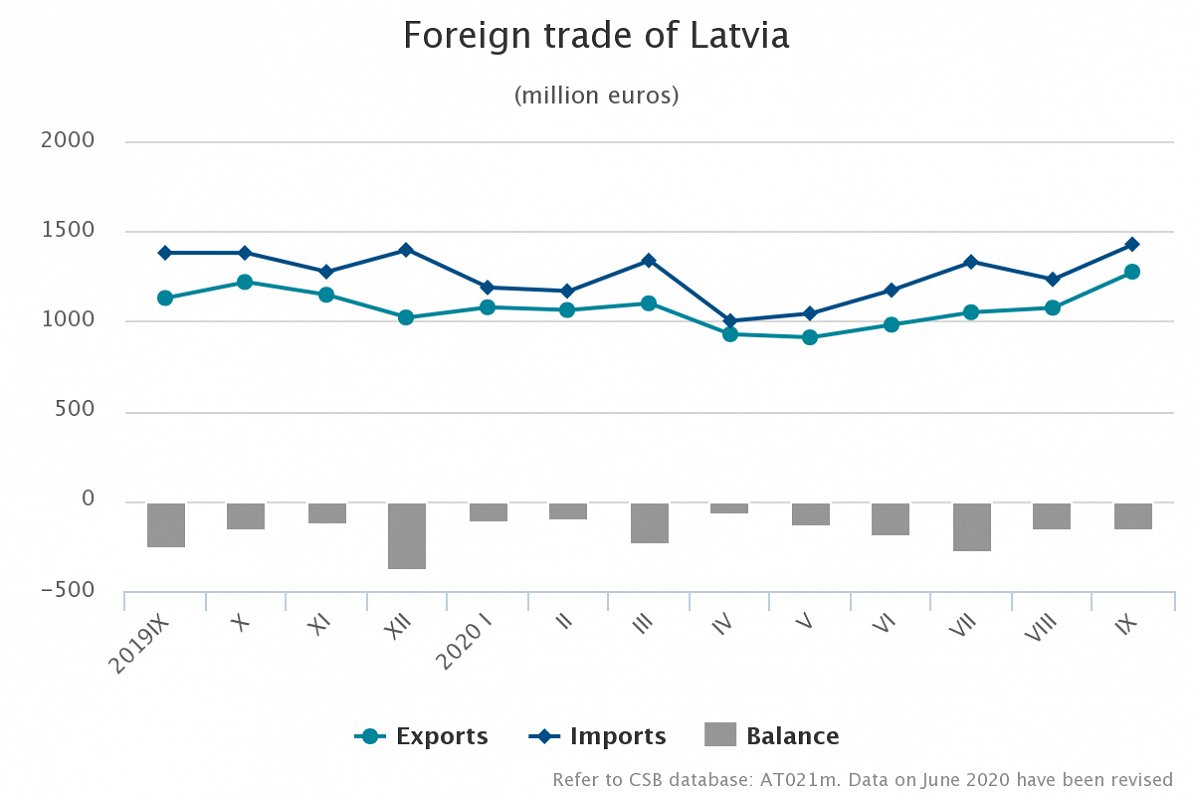
Calendar and seasonally adjusted data show that, compared to September 2019, in September 2020 the exports value at current prices went up by 9.7 % and the imports value – by 1.1 %, whereas, compared to the previous month, the exports value went up by 6.4 % ,but the imports value – by 5.1 %.
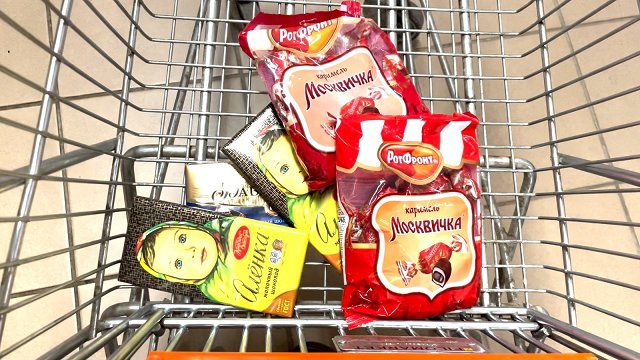
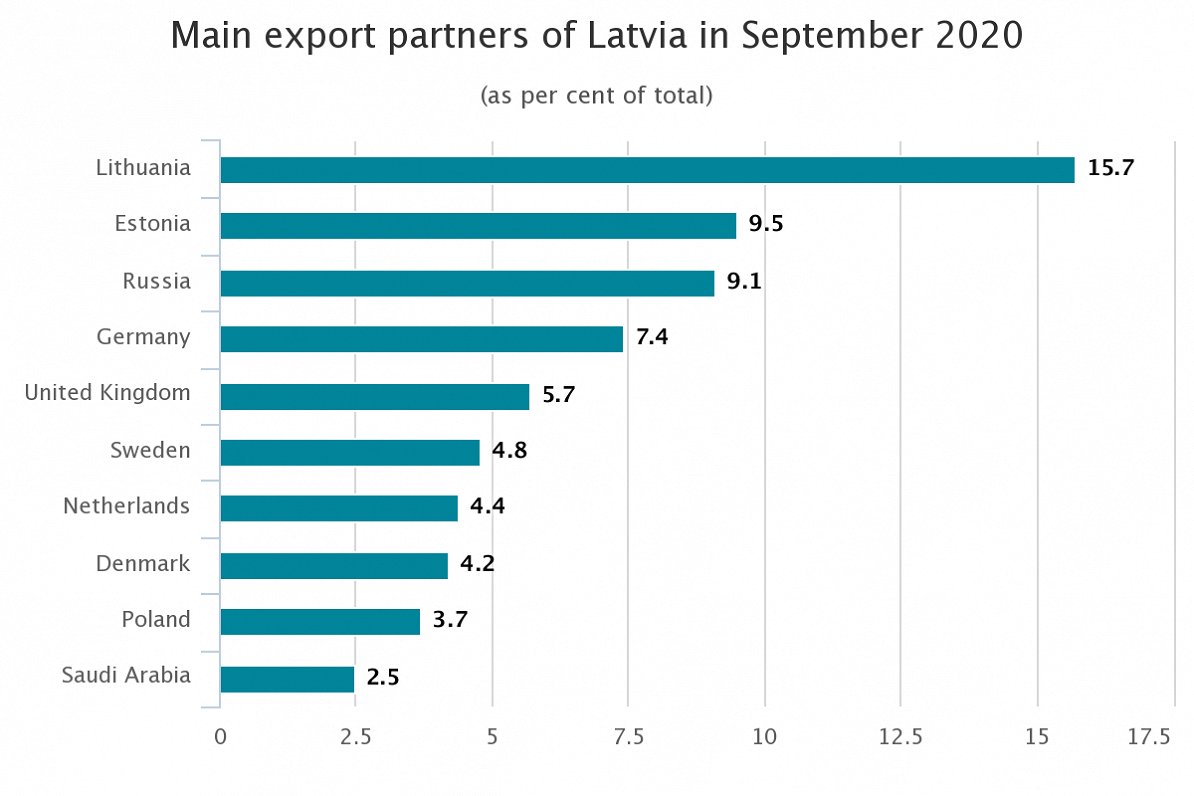
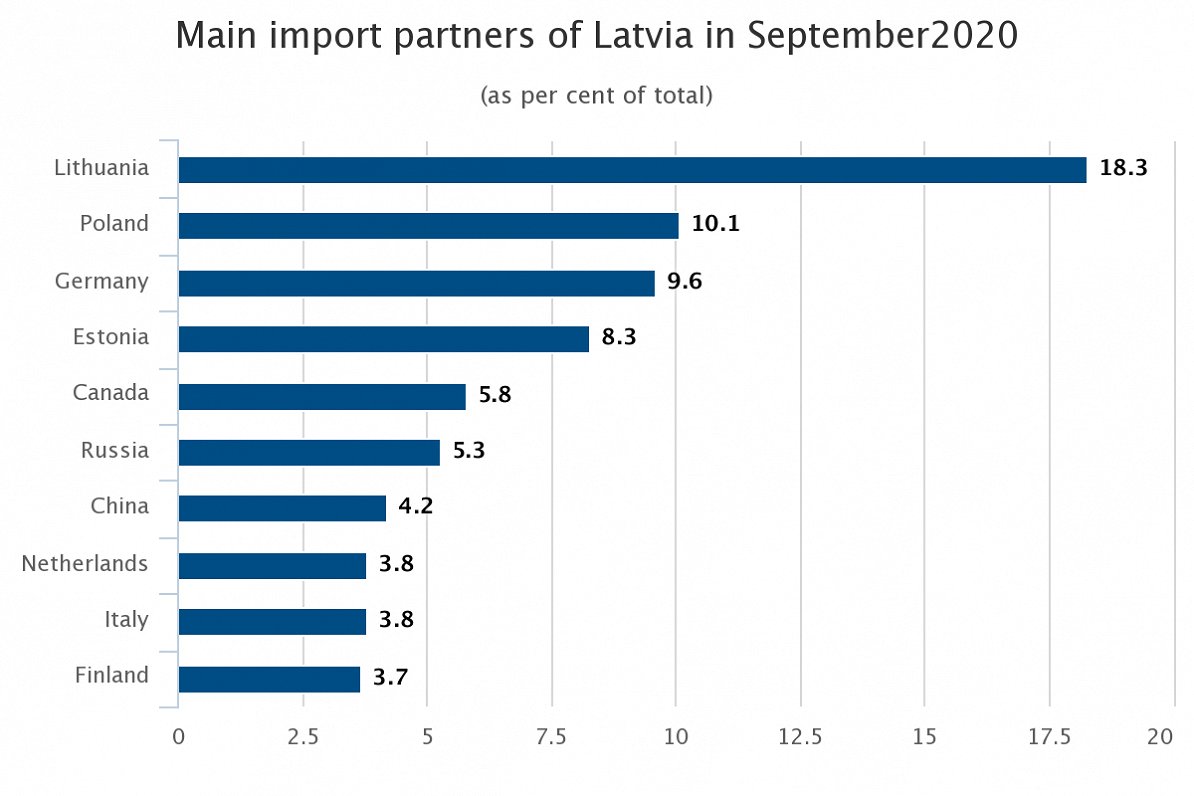
In September, the main export partners of Latvia in trade with EU countries were Lithuania (15.7 % of total exports), Estonia (9.5 %), Germany (7.4 %) and Sweden (4.8 %), whereas the main import partners were Lithuania (18.3 % of total imports), Poland (10.1 %), Germany (9.6 %) and Estonia (8.3 %). Russia was the main export partner in trade with third countries; its share in total Latvian exports in September accounted for 9.1 %, whereas the main import partner was Canada – for 5.8 % of total imports.
In September 2020, compared to September 2019, share of the European Union countries in total exports value fell by 1.2 percentage points, but in imports value – grew by 0.5 percentage points. Share of CIS countries in exports fell by 1.2 percentage points, but in imports – by 1.1 percentage point.
Foreign trade of Latvia in September 2020 by country group
(at current prices)
|
|
Exports |
Imports |
||||
|
|
million EUR |
% of total |
changes as %, compared to September 2019 |
million EUR |
% of total |
changes as %, compared to September 2019 |
|
Total |
1 275.1 |
100 |
13.0 |
1 427.9 |
100 |
3.5 |
|
European Union countries* |
803.0 |
63.0 |
10.8 |
1 053.7 |
73.8 |
4.2 |
|
euro area countries |
614.4 |
48.2 |
11.8 |
780.4 |
54.7 |
2.2 |
|
CIS countries |
165.0 |
12.9 |
3.4 |
123.3 |
8.6 |
-8.1 |
|
other countries |
307.1 |
24.1 |
25.5 |
250.9 |
17.6 |
6.8 |
*The United Kingdom is not included in the European Union.
In September 2020 foreign trade balance of Latvia was positive with 121 partner country, as exports value of goods exceeded imports value of goods. It was negative in trade with 47 countries.
Main commodities in exports of Latvia in September 2020
(at current prices)
|
|
thousand EUR |
% of total |
Changes as %, compared to |
||
|
September 2019 |
August 2020 |
average of previous 12 months |
|||
|
Total |
1 275 149 |
100 |
13.0 |
18.7 |
20.5 |
|
wood and articles of wood; wood charcoal |
166 444 |
13.1 |
0.04 |
-1.3 |
-4.5 |
|
electrical machinery and equipment |
161 717 |
12.7 |
39.6 |
22.6 |
29.8 |
|
cereals |
122 991 |
9.6 |
75.1 |
2.1 time |
2.9 times |
|
machinery and mechanical appliances |
82 052 |
6.4 |
32.2 |
23.9 |
25.3 |
|
beverages, spirits and vinegar |
59 840 |
4.7 |
-9.4 |
13.5 |
18.3 |
|
vehicles other than railway or tramway rolling stock, and parts and accessories thereof |
48 222 |
3.8 |
-19.4 |
19.7 |
-0.7 |
|
miscellaneous grains, seeds and fruit; industrial or medicinal plants |
42 452 |
3.3 |
2.3 times |
6.3 |
2.8 times |
|
iron and steel |
40 128 |
3.1 |
45.9 |
65.5 |
30.0 |
|
mineral fuels, mineral oils and products of their distillation |
39 826 |
3.1 |
-9.0 |
14.4 |
0.3 |
|
articles of iron or steel |
37 951 |
3.0 |
-13.5 |
8.0 |
2.9 |
Main commodities in imports of Latvia in September 2020
(at current prices)
|
|
thousand EUR |
% of total |
Changes as %, compared to |
||
|
September 2019 |
August 2020 |
average of previous 12 months |
|||
|
Total |
1 427 851 |
100 |
3.5 |
15.9 |
15.0 |
|
electrical machinery and equipment |
178 488 |
12.5 |
24.6 |
9.5 |
19.6 |
|
machinery and mechanical appliances |
130 776 |
9.2 |
6.0 |
13.2 |
8.1 |
|
mineral fuels, mineral oils and products of their distillation |
96 691 |
6.8 |
-28.6 |
4.9 |
11.5 |
|
vehicles other than railway or tramway rolling stock, and parts and accessories thereof |
89 011 |
6.2 |
-16.1 |
27.2 |
-0.8 |
|
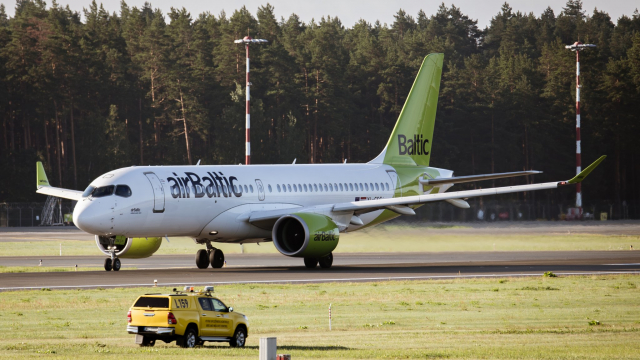
aircraft, spacecraft and parts thereof |
84 681 |
5.9 |
6.9 |
64.3 times |
3.2 times |
|
beverages, spirits and vinegar |
65 403 |
4.6 |
7.0 |
16.3 |
40.6 |
|
pharmaceutical products |
57 995 |
4.1 |
15.8 |
9.2 |
7.4 |
|
wood and articles of wood; wood charcoal |
54 361 |
3.8 |
17.4 |
13.1 |
19.0 |
|
plastics and articles thereof |
53 546 |
3.8 |
-3.2 |
8.4 |
2.0 |
|
iron and steel |
37 647 |
2.6 |
-7.5 |
-2.7 |
-13.9 |
The full report is available at CSB website.