According to data by the Central Statistics Bureau, foreign tourists crossed the border of Latvia 6.8 million times. That is 0.7% less than the previous year.
They spent €645.2m in Latvia, which is by €97.0 mln 13.1 % less than in 2015.
A total 1.8 million of the visitors were overnight travelers (11.4% less than in 2015), spending 12.3% less. Their expenses amounted to €474.4 million.
About a third - 30.1% - of the foreign travelers visited for the first time. As compared to the previous year, the total number of nights spent increased by 7.6%, reaching 8.8 million nights. Visitors stayed in Latvia for 4.9 days on average – 0.9 days more than in 2015.
Visitors by country
Compared to 2015, there was an increase in the number of foreign overnight travelers from Poland – of 8.6 %, Lithuania – of 8.5 %, Germany – of 6.7 %, and the United Kingdom – of 4.8 %.
In turn, there was a decrease in the number of foreign overnight travelers from Sweden – of 37.1 %, Belgium – of 34.6 %, the Czech Republic – of 23.4 %, Russia – of 20.3 %, and Estonia – of 7.0 %.
Reasons for stay
Most of the overnight travelers (93.0 %) came to Latvia for tourism purposes, of which 47.7 % came for recreation, 26.1 % came to visit relatives and friends, and 19.2% came on business trips. In turn, 7.0 % came to Latvia for other purposes, for example, to study.
Spendings
The average expenditure per trip around Latvia amounted to €332.70 for those travelling alone and €209.41 for those travelling with family, friends, colleagues. The average daily expenditure for those travelling on their own amounted to €62.34, whereas for those travelling with someone – €46.17.
Out of the 8.8 million nights, 37.4% were spent at rented or paid accommodation, while 62.6% were spent at private or non-rented places.
On average, a single traveler spent 6.8 days at private accommodation, which is 3.6 days more than at a rented place (3.2 days on average).
Ways of arrival
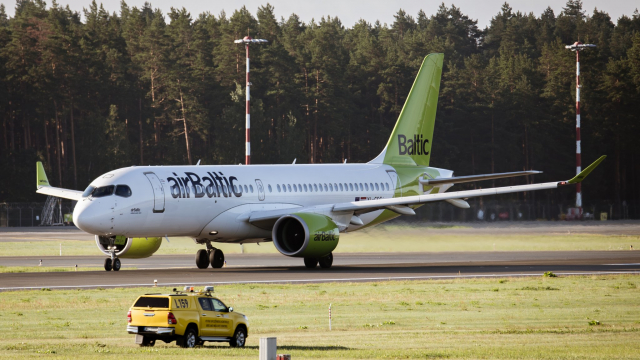
Of all the foreign overnight travellers who crossed the border of Latvia in 2016, 49.8% used road transport, 44.5% used air transport, 2.1% used sea transport and 3.6% used rail transport.
Read more about 2016 tourism trends in Latvia HERE.