Calendar adjusted data (at constant prices) show that, compared to April 2019, in April 2020 total retail trade turnover reduced by 9.0 %. Turnover of retail trade in food products declined by 3.5 %. Retail trade in non-food products (except for retail sale of automotive fuel) decreased by 14.9 %, but turnover of retail sale of automotive fuel – by 5.3 %.
As compared to April 2019, the most notable turnover growth was registered in retail sale of electrical household appliances in specialised stores (30.0 %), retail sale via mail order houses or via Internet (25.1 %) and retail trade in pharmaceutical and medical goods (3.2 %). Most significant turnover drop was registered in retail sale of clothing, footwear and leather goods (of 56.5 %) and retail sale in stalls or markets (46.0 %) and retail sale of information and communication equipment in specialized stores (24.5 %).
Total retail trade turnover at current prices decreased by 10.1 % (not taking into account the calendar influence).
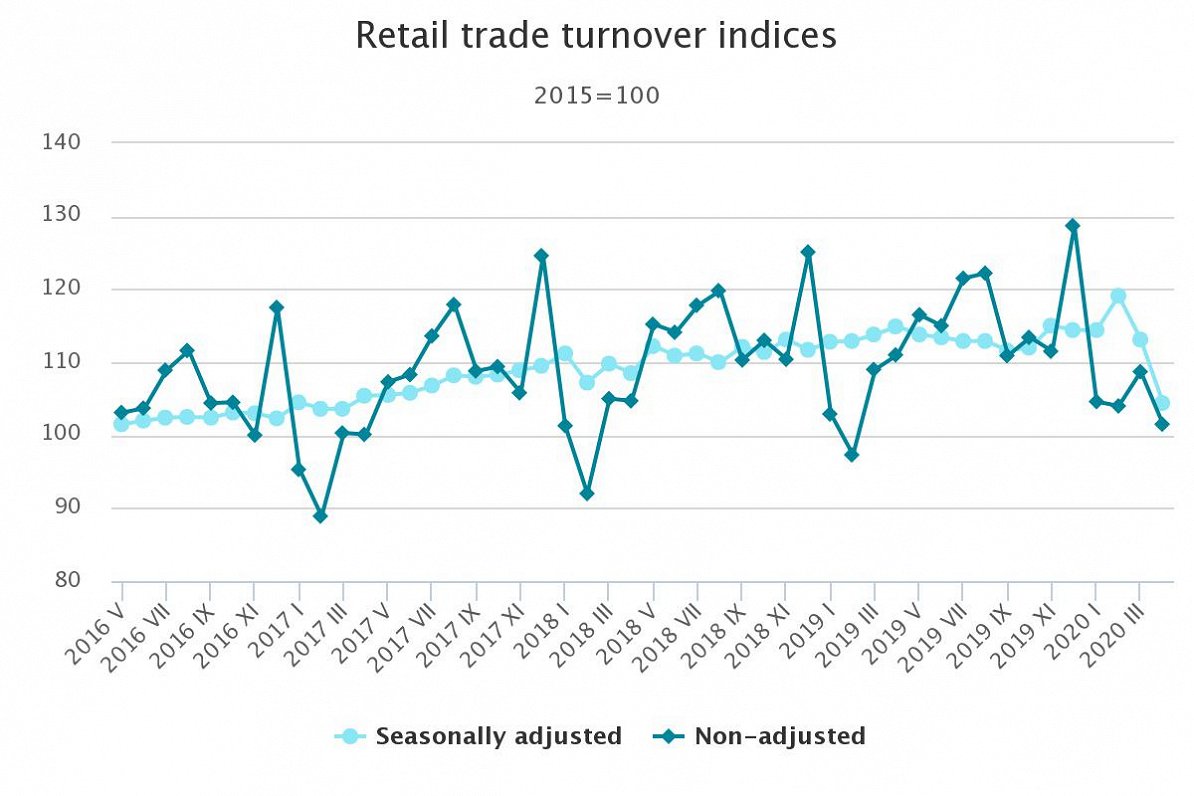
Compared to March, the total turnover of retail trade enterprises in April 2020 fell by 7.7 %, according to seasonally adjusted data at constant prices. Turnover of retail trade in food products declined by 6.9 %. Retail trade in non-food products (except for retail sale of automotive fuel) reduced by 8.4 %, but turnover of retail sale of automotive fuel – by 7.5 %.
As compared to the previous month, the most notable turnover growth was registered in retail sale via mail order houses or via Internet (of 30.6 %) and retail sale of electrical household appliances in specialized stores (10.9 %). Most significant turnover drop was registered in retail sale in stalls or markets (of 30.7 %), retail sale of clothing, footwear and leather goods (20.2 %) and retail trade in pharmaceutical and medical goods (19.5 %).
Compared to March, in April 2020 the total retail trade turnover at current prices (not taking into account seasonality) decreased by 8.4 %.
Turnover indices of retail trade enterprises by main kind of economic activity
(at constant prices)
|
|
April 2020 as %, compared to: |
|
|
March 2020 (seasonally adjusted) |
April 2019 (calendar adjusted) |
|
|
Retail trade – total |
92.3 |
91.0 |
|
retail sale of food products, total |
93.1 |
96.5 |
|
retail sale of non-food products, except for retail sale of automotive fuel, total |
91.6 |
85.1 |
|
retail sale in non-specialised stores selling mainly non-food products |
88.0 |
80.7 |
|
retail sale of information and communication equipment in specialised stores |
81.8 |
75.5 |
|
retail sale of electrical household appliances in specialised stores |
110.9 |
130.0 |
|
retail sale of hardware, instruments, construction materials and sanitary equipment |
99.5 |
93.7 |
|
retail sale of cultural and recreation goods |
98.0 |
82.9 |
|
retail trade in pharmaceutical and medical goods |
80.5 |
103.2 |
|
retail sale of cosmetics and toiletries |
84.1 |
82.4 |
|
retail sale of clothing, footwear and leather goods |
79.8 |
43.5 |
|
retail sale in stalls or markets |
69.3 |
54.0 |
|
retail sale via mail order houses or via Internet |
130.6 |
125.1 |
|
retail sale of automotive fuel |
92.5 |
94.7 |
More information on seasonally adjusted, calendar adjusted and non-adjusted retail trade turnover indices is available in the CSB database section “Trade and services”.
Data published might be revised in the following months if additional information is obtained from stores.