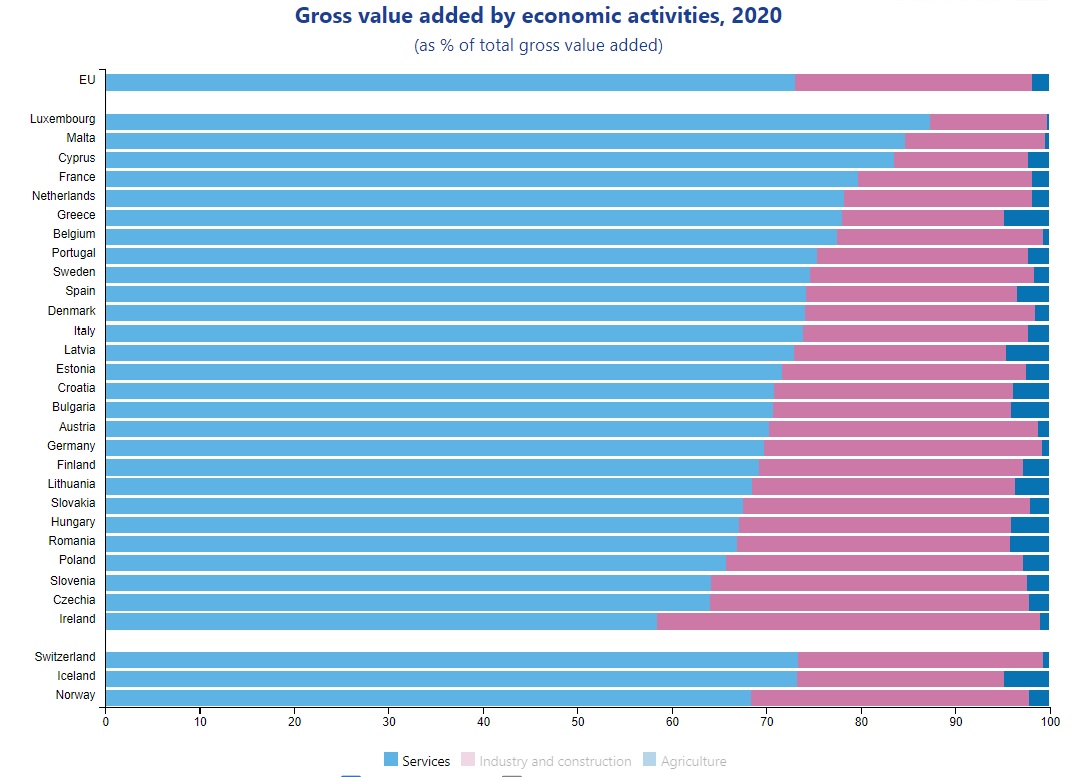
Services accounted for 73% of the European Union’s total GVA, followed by industry and construction (25%) and agriculture (2%), while in Latvia the equivalent figures were 73%, 22.4% and 4.6%.
While agriculture represented only a small part of European GVA, the highest shares were recorded in Greece and Latvia followed by Romania, Bulgaria, Hungary, Croatia and Lithuania (all 4%). On the other end, agriculture had the lowest share of the total GVA in countries like Luxembourg, Malta, Belgium and Germany where it stood below 1%.
When looking at the number of people employed in each sector, Latvian agriculture becomes even more important. Agriculture accounts for 7.5% of the workforce, industry and construction for 23.4% and services for 69%. The equivalent EU average figures are 4.5%, 22.5% and 72.9%.
In all EU countries, services had the biggest weight in the economy, varying between 58% in Ireland and 87% in Luxembourg. At the top of the list, following Luxembourg, were Malta (85%) and Cyprus (84%), while Poland (66%), as well as Czechia and Slovenia (both 64%), came at the other end of the scale, before Ireland (58%).
Industry and construction-related activities had significant weights in the economies of Ireland (41%), Czechia (34%), Slovenia (33%), Poland and Slovakia (both with 31%).
