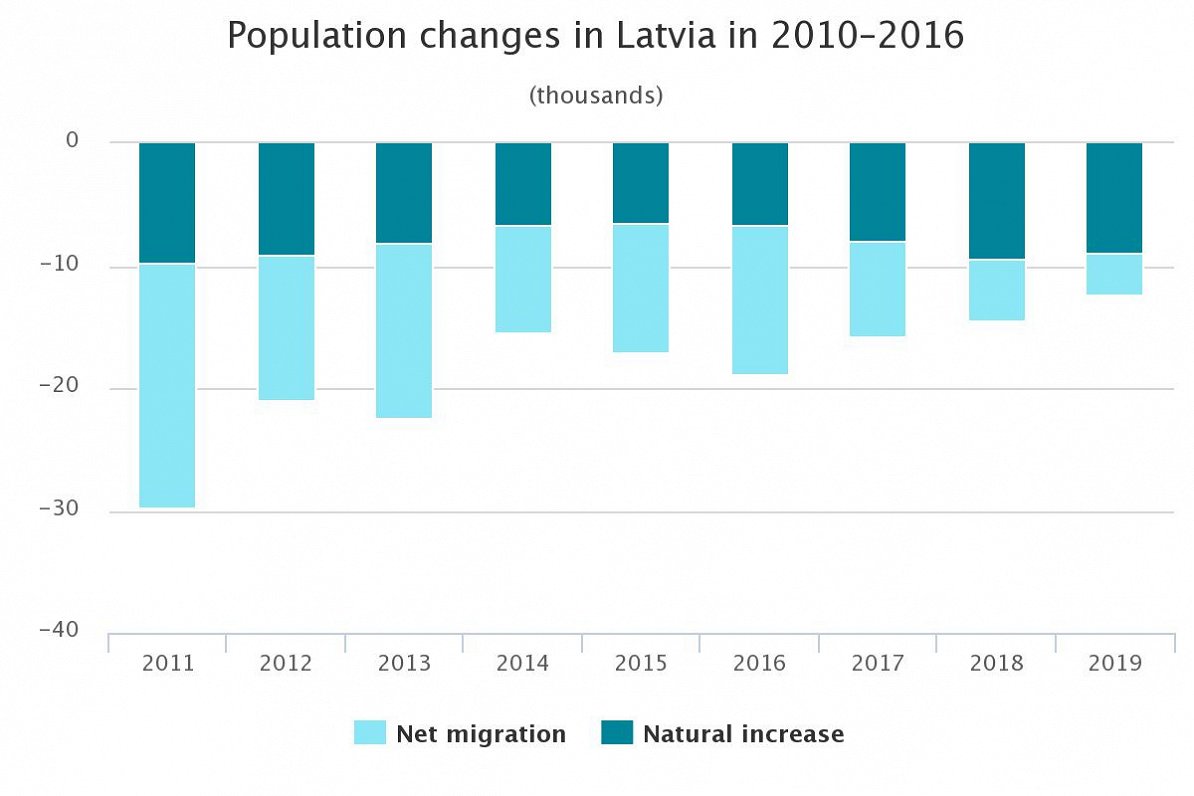
While that means a long-standing population reduction continues, one slightly encouraging sign was that fact that in 2019, international long-term migration accounted for 3,400 of that number, which is the lowest indicator recorded since 1989. Meanwhile negative natural increase resulted in a reduction of 8,900 people.
From 2008 to 2016, the number of emigrants exceeded that of immigrants, while as emigration reduced the negative natural increase recorded in the past three years exceeded the negative migration flow difference. Over the last three years, the total population of the country has been reducing at a slower rate than previously – the decline registered last year accounted for 0.64 % of the population, compared to 0.74 % in 2018 and 0.81 % in 2017.
Last year, 18,800 children were born (528 children fewer than in 2018), whereas 27,700 people died (1,101 fewer than the year before). The number of deaths last year was the lowest in the past 47 years – the last time the number of deaths was so low (27,300) was in 1972. As the number of deaths declined, the negative natural increase has dropped and comprised 8,900 (9,500 in 2018).
In 2019, 11,200 people arrived in Latvia from other countries (three hundred more than in 2018), but 14,600 left the country (1,200 less).
Out of the immigrants, 2,500 people or 23 % came from the European Union (EU) countries. It should be noted that in the compilation of statistical data the former EU member state, the United Kingdom is not included in the number any more. In 2019, 2,200 persons or 19.6 % of the total number of immigrants arrived from the United Kingdom (the same figure as in 2018). Emigration to the United Kingdom fell by 30 % in 2019 – 2,900 emigrated (4,200 in 2018)
1,500 arrived from Ukraine, 1,100 from Russia and 830 immigrants arrived from India last year (938 in 2018).
Significantly, in 2019, 5,100 thousand or 46 % of immigrants were remigrants – citizens and non-citizens of Latvia, as well as people having other citizenship but who were born in Latvia.
Demography trends in Latvia; 2017–2019
|
|
2017 |
2018 |
2019 |
2018, as % compared to 2017 |
2019, as % compared to 2018 |
per 1 000 |
|
|
2018 |
2019 |
||||||
|
Population, at the end of the year |
1 934 379 |
1 919 968 |
1 907 675 |
-0.7 |
-0.6 |
x |
x |
|
Marriages |
13 150 |
13 058 |
12 861 |
-0.7 |
-1.5 |
6.8 |
6.7 |
|
Divorces |
5 943 |
5 967 |
5 971 |
+0.4 |
+0.4 |
3.1 |
3.1 |
|
Births |
20 828 |
19 314 |
18 786 |
-7.3 |
-2.7 |
10.0 |
9.8 |
|
Deaths |
28 757 |
28 820 |
27 719 |
+0.2 |
-3.8 |
15.0 |
14.5 |
|
Immigration |
9 916 |
10 909 |
11 223 |
+10.0 |
+2.9 |
5.7 |
5.8 |
|
Emigration |
17 724 |
15 814 |
14 583 |
-10.8 |
-7.8 |
8.2 |
7.6 |