In public sector there were 8.1 thousand and in private sector 11.9 thousand job vacancies. Over the year, the number of job vacancies in private sector fell by 10 thousand or 45.7 %, while in public sector – by 0.4 thousand or 4.7 %.
Compared to the first quarter of 2020, the number of job vacancies rose by 8.2 % or 1.5 thousand. In private sector it increased by 11.8 % or 1.3 thousand, but in public sector – by 3.3 % or 0.3 thousand.
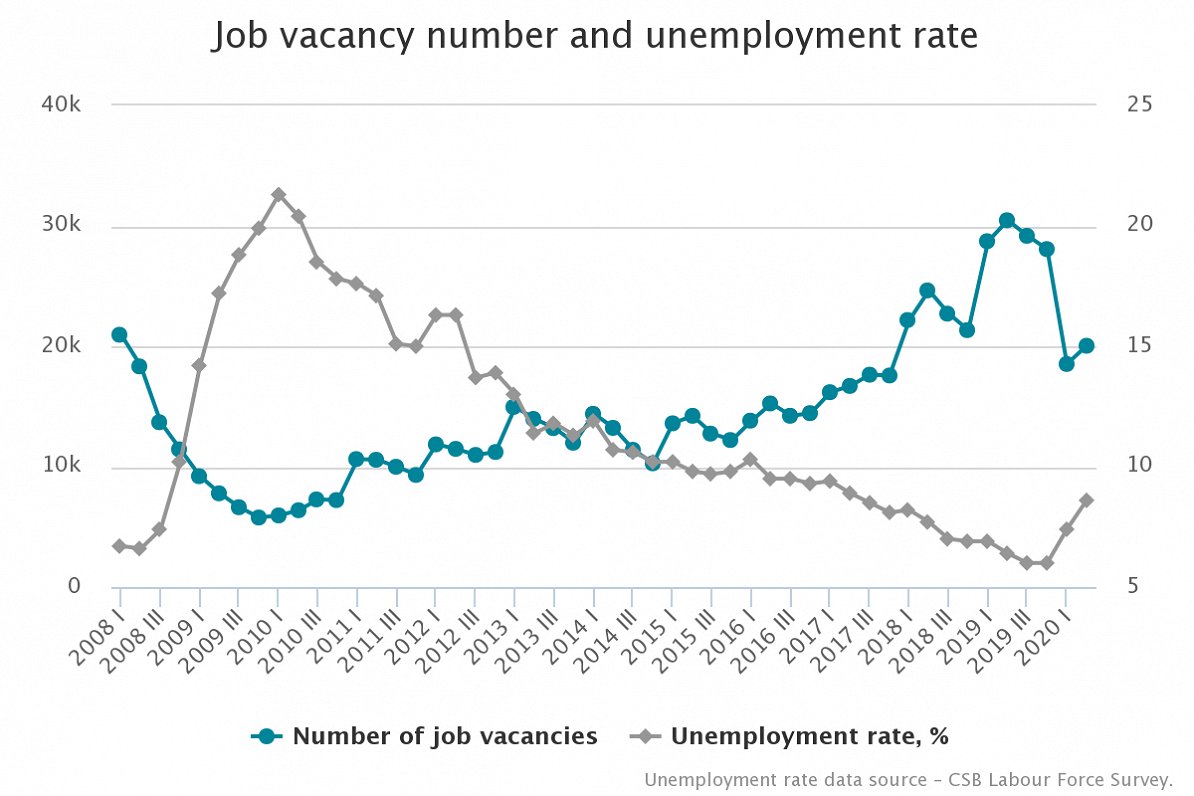
Out of the total number of jobs in Latvia (both occupied and vacant), 2.2 % positions were vacant, of which 2.8 % in public sector and 1.9 % in private sector.
Number of occupied posts reduced by 4.5 %
Compared to the second quarter of 2019, in the second quarter of 2020 number of occupied posts dropped by 41.6 thousand or 4.5 %. In private sector it fell by 35.7 thousand or 5.6 %, but in public sector – by 5.9 thousand or 2.0 %.
Compared to the previous quarter, the number of occupied posts reduced by 19.6 thousand or 2.2 %. In private sector it dropped by 15.0 thousand or 2.4 %, but in public sector – by 4.6 thousand or 1.6 %.
Occupied posts and job vacancies by sector
|
|
At the end of Q2 2019, thousand |
At the end of Q2 2020, thousand |
Changes, % |
|
Job vacancies, total |
30.5 |
20.0 |
-34.2 |
|
Private sector |
21.9 |
11.9 |
-45.7 |
|
Public sector |
8.5 |
8.1 |
-4.7 |
|
Occupied posts, total |
924.2 |
882.6 |
-4.5 |
|
Private sector |
634.5 |
598.8 |
-5.6 |
|
Public sector |
289.7 |
283.8 |
-2.0 |
The highest share of job vacancies was recorded among craft and related trades workers (3.5 %), as well as plant and machine operators and assemblers (2.5 %).
In the second quarter of 2020 the most significant drop was observed in demand for all main occupational groupings, but mostly – for craft and related trades workers, elementary occupations, skilled agricultural, forestry and fishery workers, service and sales workers, and professionals.
In the second quarter of 2020, the highest share of job vacancies was recorded in public administration (6.0 %), manufacturing (3.0 %), accommodation and food service activities (2.9 %), mining and quarrying, as well as construction (2.8 %).
Job vacancies and occupied posts by main kind of economic activity
|
|
Q2 2019 |
Q2 2020 |
||||
|
Job vacancies, thousand |
Occupied posts, thousand |
Job vacancy rate,% |
Job vacancies, thousand |
Occupied posts, thousand |
Job vacancy rate,% |
|
|
Total |
30.5 |
924.2 |
3.2 |
20.0 |
882.6 |
2.2 |
|
Agriculture, forestry and fishing (A) |
0.8 |
23.2 |
3.3 |
0.3 |
22.7 |
1.3 |
|
Mining and quarrying (B) |
0.2 |
3.7 |
4.1 |
0.1 |
3.8 |
2.8 |
|
Manufacturing (C) |
4.6 |
113.5 |
3.9 |
3.3 |
109.2 |
3.0 |
|
Electricity, gas, steam and air conditioning supply (D) |
0.3 |
11.6 |
2.6 |
0.2 |
11.5 |
1.4 |
|
Water supply, sewerage, waste management and remediation activities (E) |
0.3 |
8.1 |
3.2 |
0.1 |
7.7 |
1.4 |
|
Construction (F) |
3.3 |
65.9 |
4.8 |
1.8 |
63.6 |
2.8 |
|
Wholesale and retail sale; repair of motor vehicles and motorcycles (G) |
5.3 |
147.6 |
3.5 |
1.8 |
139.4 |
1.3 |
|
Transportation and storage (H) |
2.7 |
77.4 |
3.4 |
1.9 |
70.7 |
2.7 |
|
Accommodation and food service activities (I) |
1.4 |
38.1 |
3.6 |
0.8 |
27.9 |
2.9 |
|
Information and communication (J) |
0.8 |
35.0 |
2.2 |
0.7 |
35.6 |
2.0 |
|
Financial and insurance activities (K) |
0.3 |
17.5 |
1.7 |
0.3 |
16.9 |
1.5 |
|
Real estate activities (L) |
0.2 |
28.2 |
0.8 |
0.4 |
28.0 |
1.5 |
|
Professional, scientific and technical activities (M) |
0.8 |
41.2 |
1.8 |
0.2 |
39.3 |
0.6 |
|
Administrative and support service activities (N) |
1.2 |
41.3 |
2.9 |
0.5 |
38.5 |
1.4 |
|
Public administration and defence; compulsory social security (O) |
4.1 |
63.9 |
6.1 |
4.0 |
62.6 |
6.0 |
|
Education (P) |
1.4 |
97.6 |
1.4 |
1.2 |
97.9 |
1.2 |
|
Human health and social work activities (Q) |
2.2 |
70.2 |
3.0 |
2.0 |
71.6 |
2.7 |
|
Arts, entertainment and recreation (R) |
0.4 |
25.8 |
1.4 |
0.2 |
23.0 |
1.0 |
|
Other service activities (S) |
0.2 |
14.4 |
1.7 |
0.0 |
12.7 |
0.3 |
In the second quarter of 2020, the greatest share of job vacancies was observed in Riga region – 2.7 % of all jobs within the region or 13.3 thousand, whereas the lowest – in Zemgale region – 1.1 % or 0.8 thousand.
The highest share of job vacancies in the Baltic countries recorded in Latvia
Among all Baltic countries, in the second quarter of 2020 the highest share of job vacancies (2.2 %) was registered in Latvia. In Lithuania and Estonia this indicator was lower – 1.3 %, but average in the EU – 1.6 %. Over a year the sharpest drop of job vacancies was in Latvia – by 34.2 %, in Estonia – by 27.7 %, but in Lithuania – by 7.4 %.