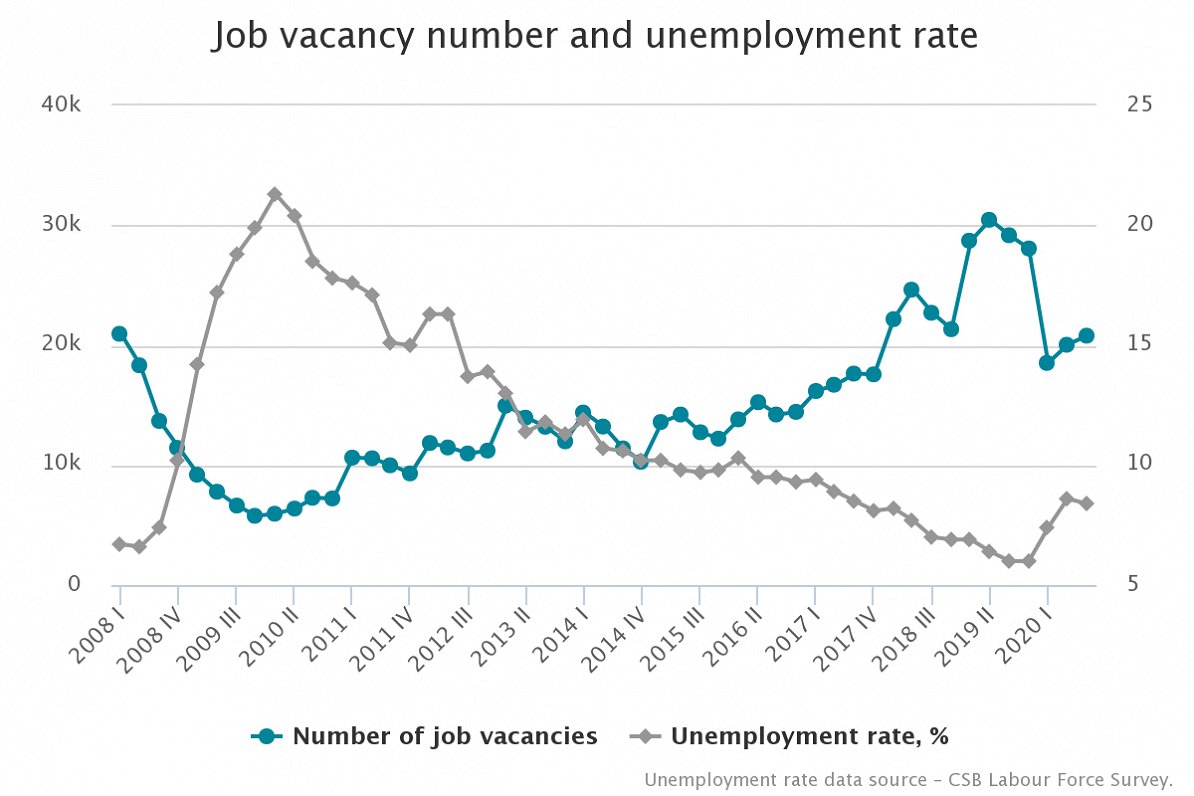
Compared to the third quarter of the year 2019, this number has decreased by 8.4 thousand or 28.7%.
There were 7.9 thousand job vacancies in the public sector, but 12.9 thousand in the private sector. During the year, the number of job vacancies in the private sector decreased by 8.4 thousand or 39.5%, while in the public sector it slightly increased - by 0.1 thousand or 0.7%.
Compared to the previous quarter, the number of job vacancies increased by 3.8% or 0.8 thousand. In the private sector the number increased by 8.3 % or 1.0 thousand, while in the public sector it decreased - by 2.9% or 0.2 thousand.
Of all jobs available in Latvia (occupied and vacant), 2.3% were vacant, of which 2.7% in the public sector and 2.1 % in the private sector.
In the third quarter of 2020, compared to the third quarter of 2019, the number of occupied posts decreased by 19.5 thousand. or 2.1 %. In the private sector it decreased by 19.2 thousand. or 3.0%, while in the public sector - by 0.3 thousand. or 0.1%.
Compared to the previous quarter, the number of occupied posts increased by 16.2 thousand or 1.8%. In the private sector it increased by 12.3 thousand. or 2.1%, but in the public sector - by 3.8 thousand. or 1.4%.
Occupied posts and vacancies by sector
|
|
At the end of the 3rd quarter of 2019, thousand |
At the end of the 1st quarter of 2020, thousand |
At the end of the 2nd quarter of 2020, thousand |
At the end of the 3rd quarter of 2020, thousand |
Changes in the 3rd quarter of 2020 (%) against |
|
|
3rd quarter of 2019 |
2nd quarter of 2020 |
|||||
|
Total of vacancies |
29.2 |
18.5 |
20.0 |
20.8 |
-28.7 |
3.8 |
|
In private sector |
21.3 |
10.6 |
11.9 |
12.9 |
-39.5 |
8.3 |
|
In public sector |
7.8 |
7.9 |
8.1 |
7.9 |
0.7 |
-2.9 |
|
Total of occupied posts |
918.2 |
902.2 |
882.6 |
898.7 |
-2.1 |
1.8 |
|
In private sector |
630.2 |
613.7 |
598.8 |
611.1 |
-3.0 |
2.1 |
|
In public sector |
287.9 |
288.5 |
283.8 |
287.7 |
-0.1 |
1.4 |
Of all jobs, the highest share of job vacancies was in the basic group of skilled workers and craftsmen - 3.7 %, as well as in the basic group of plant and machinery operators - 2.5%.
In the third quarter of 2020, the demand for workers decreased in all major occupational groups, but most of all for skilled agricultural, forestry and fisheries workers, plant and machinery operators and product fitters, specialists, ordinary workers, and skilled workers and craftsmen.
In the third quarter of 2020, the highest share of job vacancies was in public administration - 5.5 %, in the manufacturing sector - 3.3 %, in the health and social care sector - 3.0 %, in the transport and storage sector 2.9 %, as well as in the construction sector - 2.7 %.
Number of occupied posts and job vacancies by type of economic activity
|
|
3rd quarter of 2019 |
3rd quarter of 2020 |
||||
|
Number of job vacancies, thousands |
Number of occupied posts, thousands |
Number of job vacancies,% |
Number of job vacancies, thousands |
Number of occupied posts, thousands |
Number of job vacancies,% |
|
|
Total |
29.2 |
918.2 |
3.1 |
20.8 |
898.7 |
2.3 |
|
Agriculture, forestry and fisheries (A) |
0.7 |
22.9 |
3.1 |
0.3 |
22.6 |
1.1 |
|
Mining and quarrying (B) |
0.1 |
3.3 |
3.5 |
0.0 |
3.4 |
0.5 |
|
Manufacturing (C) |
4.3 |
113.0 |
3.6 |
3.8 |
111.5 |
3.3 |
|
Electricity, gas, steam and air conditioning supply (D) |
0.3 |
11.8 |
2.4 |
0.2 |
11.5 |
1.5 |
|
Water supply; sewage, waste management and remediation activities (E) |
0.3 |
8.1 |
3.4 |
0.1 |
7.7 |
1.8 |
|
Construction (F) |
3.1 |
66.1 |
4.5 |
1.8 |
64.6 |
2.7 |
|
Wholesale and retail trade; repair of motor vehicles and motorcycles (G) |
5.4 |
145.6 |
3.6 |
2.1 |
142.7 |
1.5 |
|
Transportation and storage (H) |
3.1 |
76.8 |
3.8 |
2.1 |
70.3 |
2.9 |
|
Accommodation and service activities (I) |
1.6 |
36.7 |
4.2 |
0.7 |
30.5 |
2.3 |
|
Information and communication (J) |
0.7 |
35.2 |
1.8 |
0.7 |
36.0 |
2.0 |
|
Financial and insurance activities(K) |
0.3 |
17.3 |
1.9 |
0.2 |
16.6 |
1.4 |
|
Real estate activities (L) |
0.3 |
28.3 |
1.0 |
0.7 |
28.2 |
2.3 |
|
Professional, scientific and technical activities (M) |
0.6 |
41.6 |
1.5 |
0.3 |
40.0 |
0.8 |
|
Administrative and support service activities (N) |
1.0 |
41.4 |
2.3 |
0.6 |
39.3 |
1.6 |
|
Public administration and defence; compulsory social security (O) |
4.0 |
62.7 |
6.0 |
3.7 |
63.3 |
5.5 |
|
Education (P) |
1.0 |
97.7 |
1.0 |
1.0 |
100.3 |
1.0 |
|
Human health and social work activities (Q) |
2.1 |
70.2 |
3.0 |
2.3 |
72.6 |
3.0 |
|
Arts, entertainment and recreation (R) |
0.2 |
25.2 |
0.8 |
0.2 |
24.0 |
0.7 |
|
Other service activities (S) |
0.1 |
14.3 |
0.8 |
0.0 |
13.5 |
0.2 |
In various regions, in the third quarter of 2020, the highest share of job vacancies was in the Riga municipality - 2.8 % or 14.1 thousand, while the lowest - in the Zemgale region - 1.1 % or 0.8 thousand.
Comparing the Baltic States, in the third quarter of 2020, the highest share of job vacancies (2.3 %) was in Latvia. In Lithuania and Estonia this indicator was lower - 1.4 %, but on average in the European Union - 1.7 %. During the year, the number of job vacancies decreased the most in Latvia - by 28.7 %, in Estonia - by 26.9 %, while in Lithuania it increased - by 0.8 %.